Setting up Xdebug with Lagoon#
Enable Xdebug extension in the containers#
The Lagoon base images are pre-configured with Xdebug but, for performance
reasons, the extension is not loaded by default. To enable the extension, the
XDEBUG_ENABLE environment variable must be set to true:
-
Locally (Pygmy and Lando)
- If your project is based off the lagoon-examples
docker-compose.ymlfile, the environment variable already exists. Uncomment these lines. - Make sure to rebuild and restart the containers after changing any environment variables. - Remotely (dev/prod)
- You can use the Lagoon API to add the environment variable to a running environment.
- Make sure to redeploy the environment after changing this any environment variables.
- If your project is based off the lagoon-examples
Activate Xdebug Extension#
The default Xdebug configuration requires a "trigger" to activate the extension and start a session. You can view the complete documentation for activating the debugger but the most straightforward instructions are below.
CLI#
The php-cli image is configured to always activate Xdebug when it’s enabled,
so there is nothing else that needs to be done. Running any PHP script will
start a debugging session.
Web#
Install a browser extension to set/unset an activation cookie.
Make sure the activation cookie is set for the website you want to start debugging.
Configure PHPStorm#
- PHPStorm is configured correctly by default.
- Click the “Start Listening for PHP Debug Connections” icon in the toolbar.
- Load a webpage or run a Drush command.
- On first run, PHPStorm should pop up a window asking you to:
- Confirm path mappings.
- Select the correct file locally that was triggered on the server.
Configure Visual Studio Code#
- Install the PHP Debug extension by Felix Becker.
- Follow the instructions
to create a basic
launch.jsonfor PHP. -
Add correct path mappings. For a typical Drupal site, an example would be:
-
In the Run tab of Visual Studio Code, click the green arrow next to “Listen for Xdebug”
- Load a webpage or run a Drush command.
Troubleshooting#
- Verify that Xdebug extension is loaded. The best way to do this on a Drupal site is to check the PHP status page. You should find a section about Xdebug and all its settings.
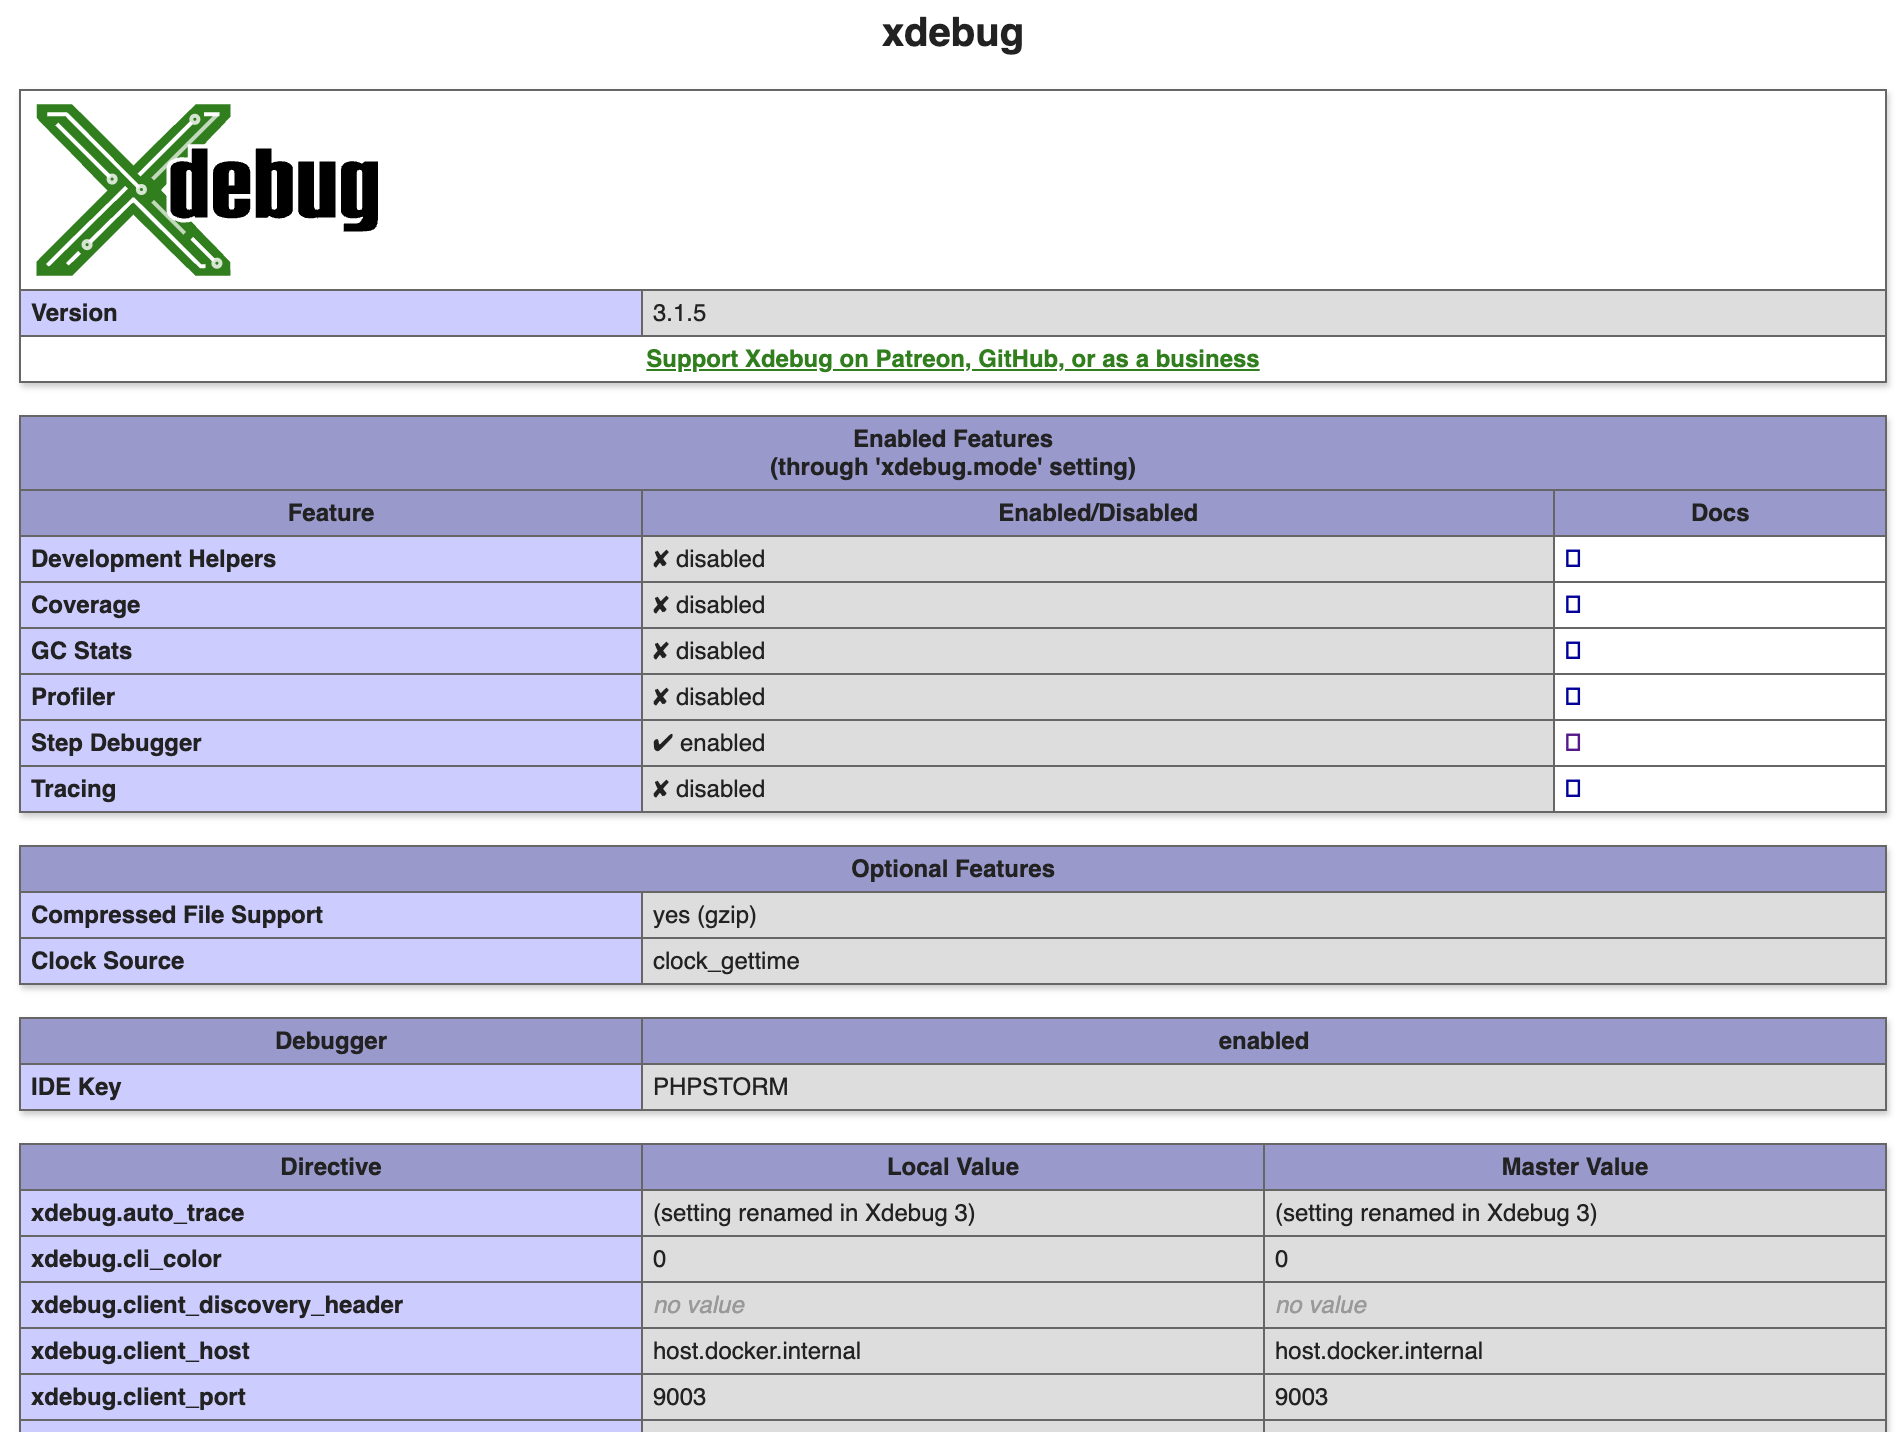
- Verify the following settings:
| Directive | Local Value |
|---|---|
| xdebug.mode | debug |
| xdebug.client_host | host.docker.internal or your IP address |
| xdebug.client_port | 9003 |
- Enable Xdebug logging within the running containers. All you need is an
environment variable named
XDEBUG_LOGset to anything to enable logging. Logs will be saved to/tmp/xdebug.log. If you are using the lagoon-examples then you can uncomment some existing lines. - Verify you have the activation cookie set. You can use the browser tools in
Chrome or Firefox to check that a
XDEBUG_SESSIONcookie is set. - Verify that Xdebug is activated and attempting to start a debug session with
your computer. You can use the
nc -l 9003command line tool to open the Xdebug port. If everything is configured in PHP correctly, you should get a Xdebug init response when you load a webpage or run a Drush command. - Verify that the
xdebug.client_hosthas been set correctly. For local debugging with Docker for Mac, this value should behost.docker.internal. For remote debugging this value should be your IP address. If this value was not correctly determined, you can override it by setting theDOCKERHOSTenvironment variable. - When using Lando locally, in order to debug scripts run from the CLI you must
first SSH into the CLI container via
lando ssh. You won’t be able to debug things by runninglando drushorlando php.
Mac specific troubleshooting#
-
Verify that Docker for Mac networking is not broken. On your host machine, run
nc -l 9003, then in a new terminal window, run:You should see a message like:
host.docker.internal (192.168.65.2:9003) open.
Linux specific troubleshooting#
-
Ensure the host
host.docker.internalcan be reached. Ifdockerhas been installed manually (and not through Docker Desktop), this host will not resolve. You can force this to resolve with an additional snippet in yourdocker-compose.ymlfile (instructions taken from this blog post):
Xdebug 2#
If you're running older images you may still be using Xdebug version 2. All the information on this page still applies, but some of the configuration names and values have changes:
| v3 | v2 | |
|---|---|---|
| xdebug.mode | xdebug.remote_enabled | On |
| xdebug.client_host | xdebug.remote_host | host.docker.internal or your IP address |
| xdebug.client_port | xdebug.remote_port | 9000 |
